Most people think that since we live in a community with high property values, our schools must be well-funded. But that's just not the case.
Actually, Moraga's schools are among the lowest-funded in the state.
How can this be? |
|
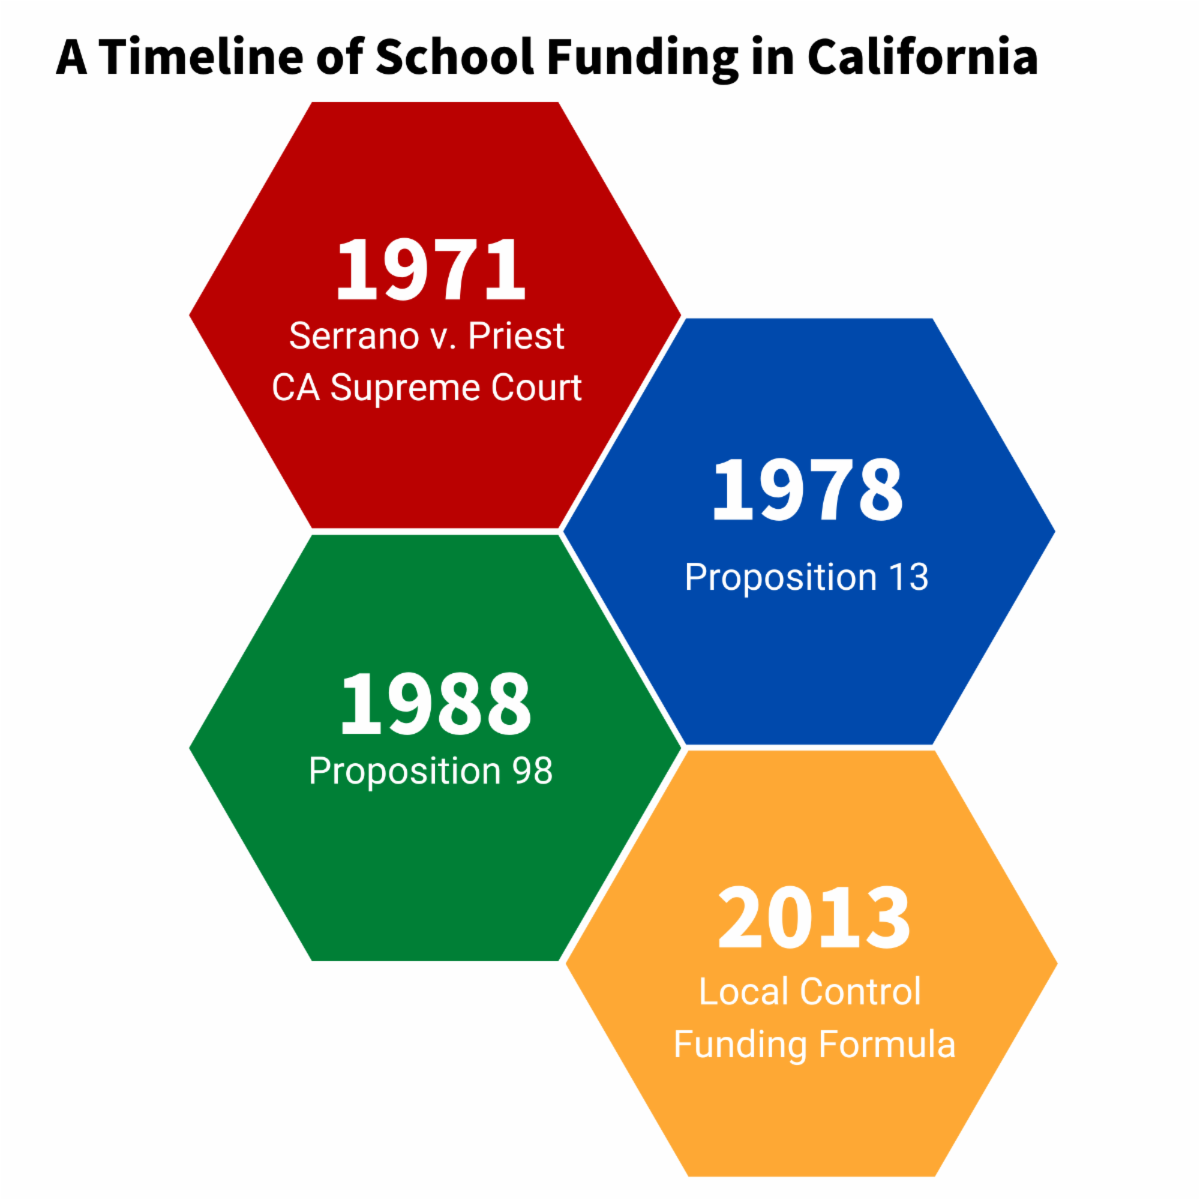
A History of School Funding in California |
|
|
In the 1960s, California ranked in the top 5 states in per-pupil funding. At that time, California funded its schools through property taxes, and local school boards had the power to set property tax rates. Because of this, the amount raised for schools varied a lot depending on the local tax rate and the assessed value of the local property. This system was great for property-rich districts, but not so great for communities with low property values or lots of students.
In 1971, the California Supreme Court ruled this system unconstitutional in a case called Serrano v. Priest and ordered the state to equalize funding. Court mandates limited the amount of property taxes that could go toward each community's local schools and redistributed the excess. The intention was to equalize per-student funding among districts over time. |
|
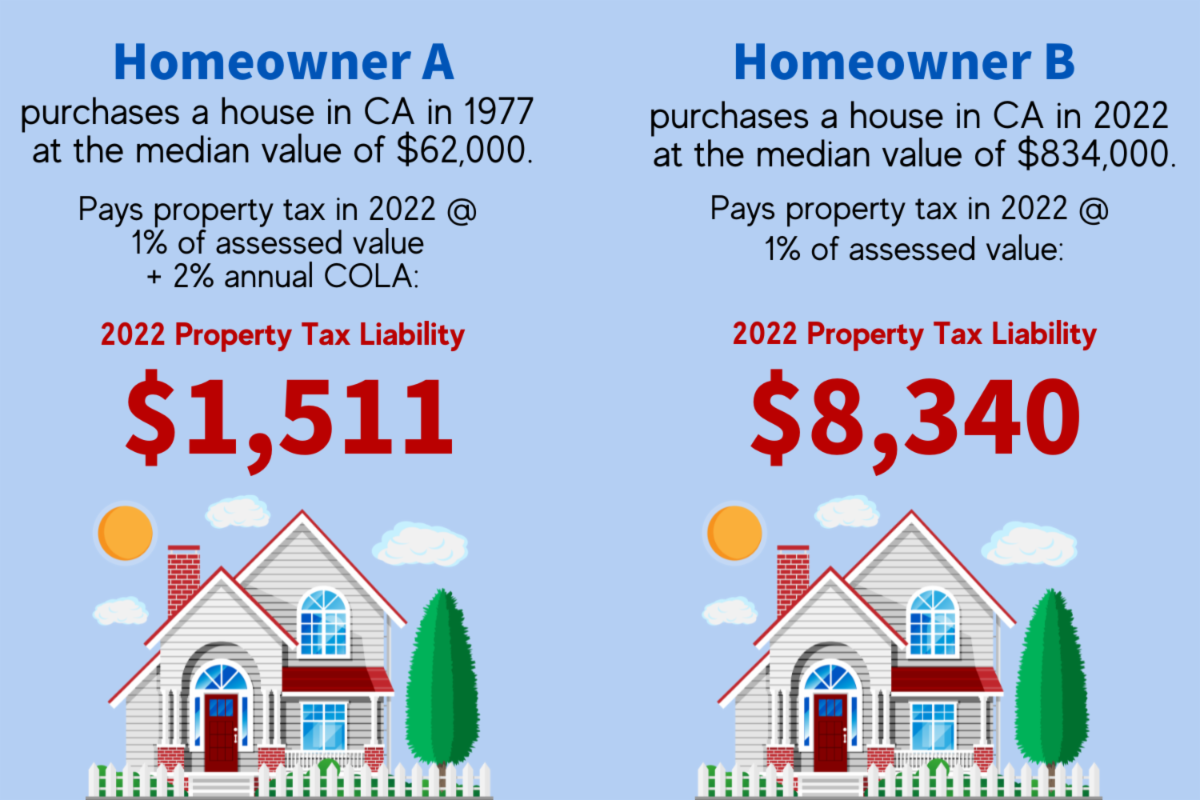
In 1978, Californians passed Proposition 13. Prop 13 removed the power of school boards to levy local property taxes to benefit their schools. It also dramatically lowered the property tax rate across the state to 1% of a property's assessed value. In addition, the assessed value of a property was frozen at the purchase price, except for annual cost-of-living increases limited to 2%. Essentially, Prop 13 changed the market-value-based property tax system to an acquisition-value-based system, so similar properties can have substantially different assessed values based solely on the date the property was purchased. |
|
Example showing the effect of Prop 13 |
| Homeowner A purchased a home in 1977 at the median price of homes in CA that year ($62,000). Even if their home had been reassessed annually at the maximum allowed 2% cost of living increase, then in the year 2022, Homeowner A would pay just over $1,500 in property taxes.
Homeowner B purchases substantially the same home in 2022 at the median price of homes in CA that year ($834,000). In that year (2022), Homeowner B would pay over $8,000 in property taxes. |
|
|
|
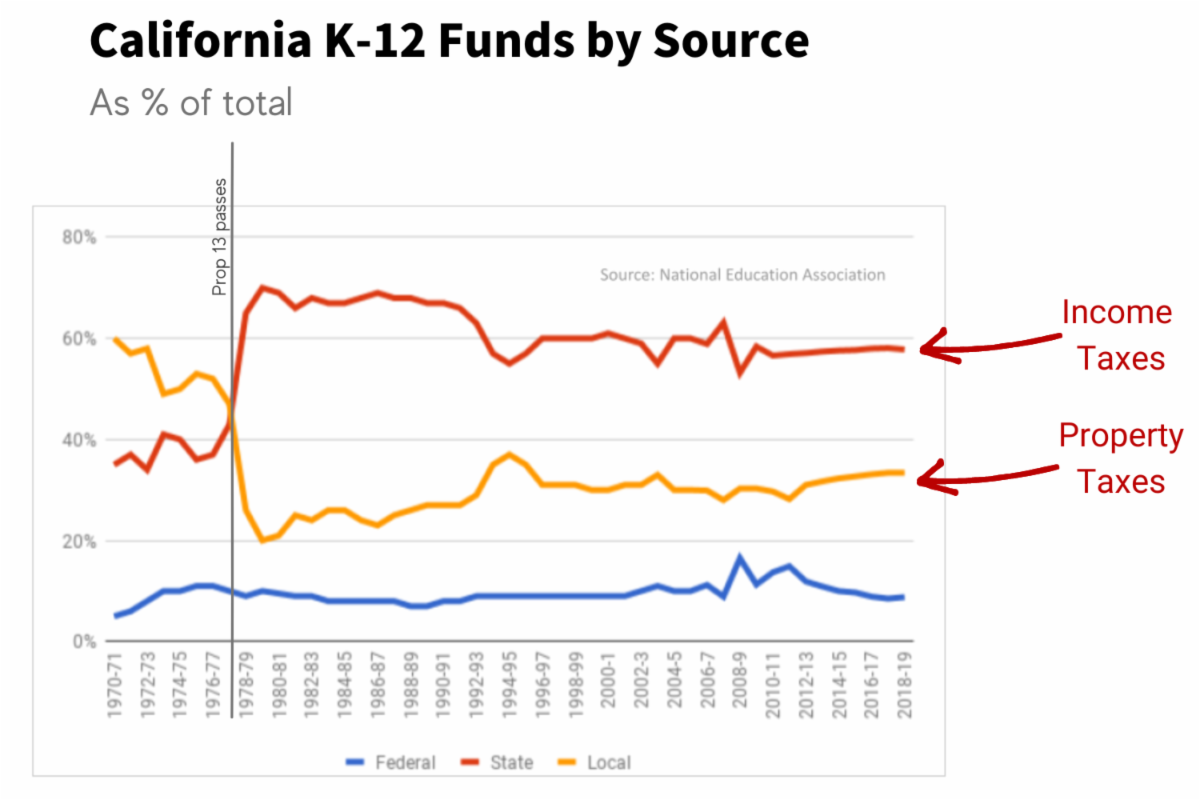
Because it lowered the property tax rate to 1% throughout the state, Prop 13's effect on tax revenue was immense - state property tax revenue fell by between 4 and 5 billion dollars. Since there was now significantly less revenue coming from property taxes, there wasn't enough to fully fund our schools, and school funding had to be supplemented by income tax revenue. |
|
The roles of property tax revenue and income tax revenue in school funding completely flip-flopped when Prop 13 was passed. |
|
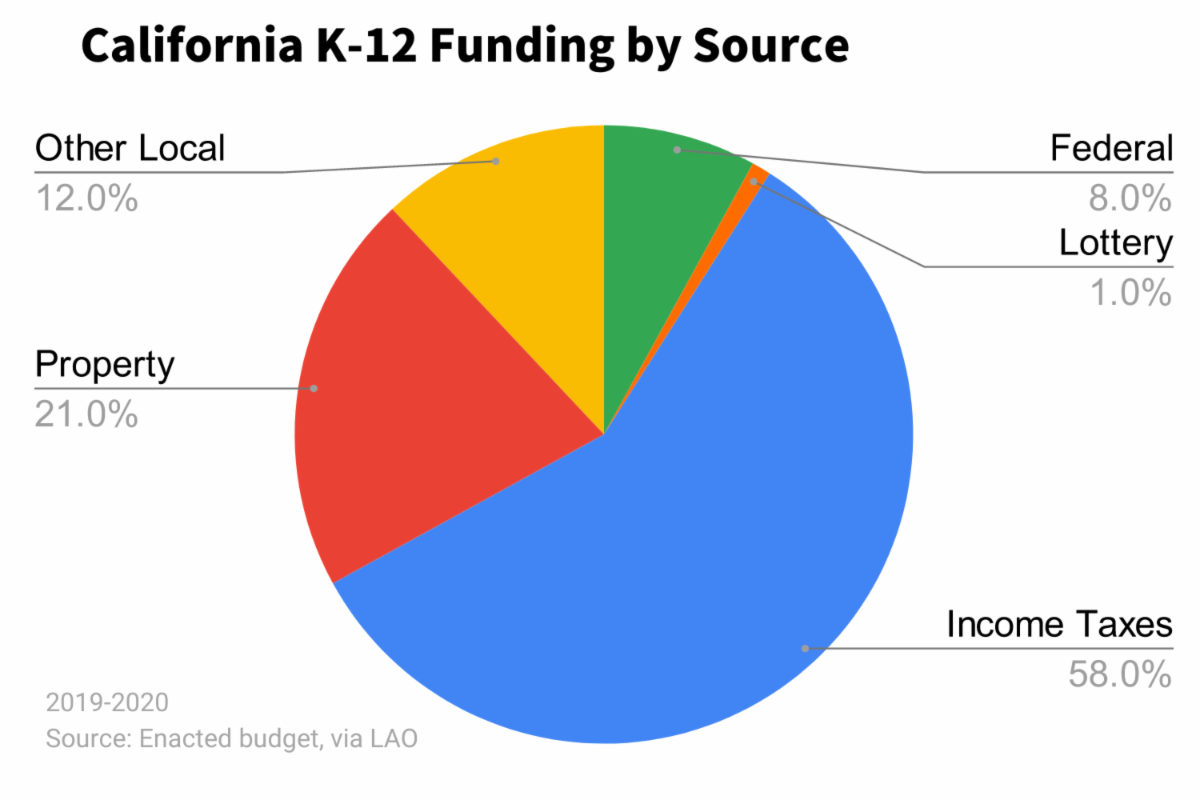
Today, local property taxes account for only about 21% of school funding in California. State income taxes make up the bulk of the funding. |
|
The Serrano decision and Proposition 13 shifted California's education funding system from a local system reliant on local property taxes to a state system reliant on state income taxes. The old system certainly was inequitable, but it was better at raising funds in the aggregate. |
|
| Concerns about inadequate school funding started almost immediately after Prop 13 was passed. There has been a long decline since then in California's investment in public education relative to its history, its economy, and relative to other states.
This decline came to a head in 1988, and voters demanded change by passing Proposition 98. Prop 98 amended the California Constitution to guarantee that a larger and more consistent fraction of the state budget is spent on education. Simply put, it mandated that the government spend roughly 40% of its budget on K-14 education (K-12 and community colleges).
Like everything else related to school funding, Prop 98 is actually a lot more complicated than that and unfortunately has resulted in our leaders fighting budget battles based on legal details and formulas rather than on what students actually need, meaning that Prop 98 acts as a ceiling as much as a floor.
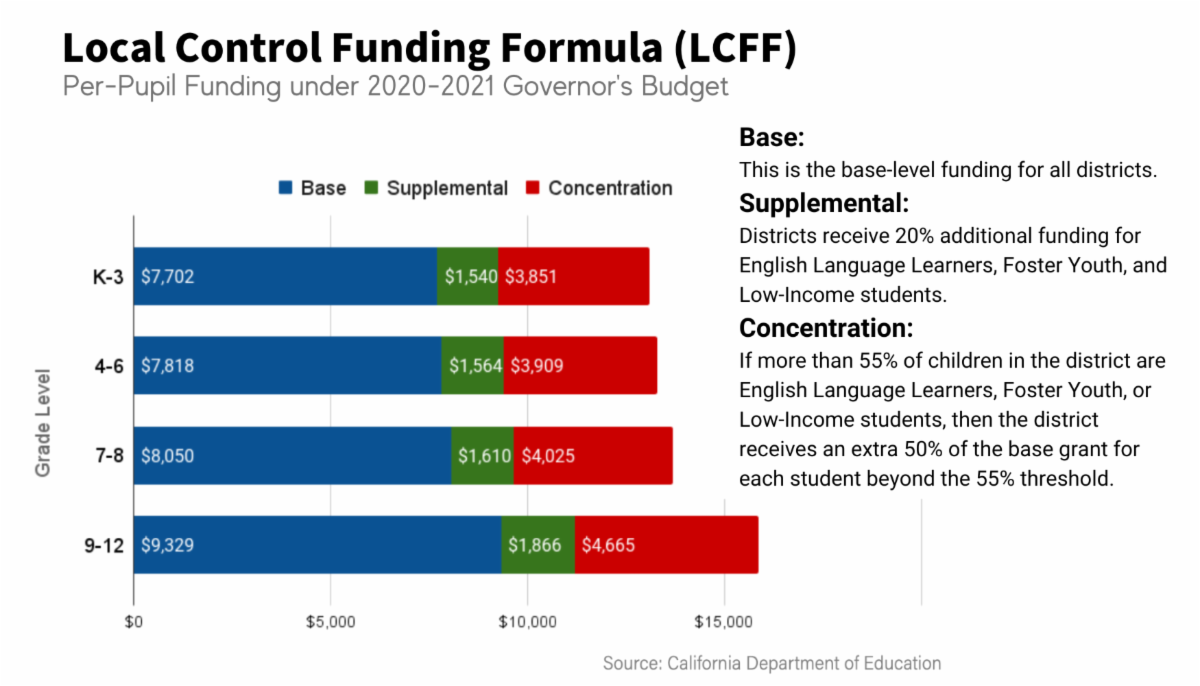
The most recent critical change to school funding in CA came in 2013 when CA instituted the Local Control Funding Formula (LCFF) to determine how funding would be allocated among districts. All districts receive a base grant, and then those districts with higher numbers and higher concentrations of foster youth, English Language Learners, and Low-Income students receive additional funding. Funding also differs based on the grade level of the students, with schools receiving more funding for older students as shown in the chart below. |
|
|
| As the chart above shows, in the 2020-2021 school year, a school received $7,702 per student in kindergarten, first, second, and third grades. Then, for each student who was an English Language Learner (ELL), foster youth, or low-income, the school received an additional $1,540. If more than 55% of children in the district qualified as ELL, foster youth, or low-income, then the school would receive an additional $3,851 per student beyond the 55% threshold. The Local Control Funding Formula is one of the most progressive school funding systems in the country.
So just to review, California school funding today is a product of the Serrano decision, which ruled our local funding system unconstitutional, Prop 13 which eliminates local control and severely reduces property tax revenue, Prop 98 which required the state to spend 40% of its budget on K-12 education and community colleges, and the Local Control Funding Formula which dictates how the education dollars are distributed among the districts in California. |
|
|
School Funding in California Today |
|
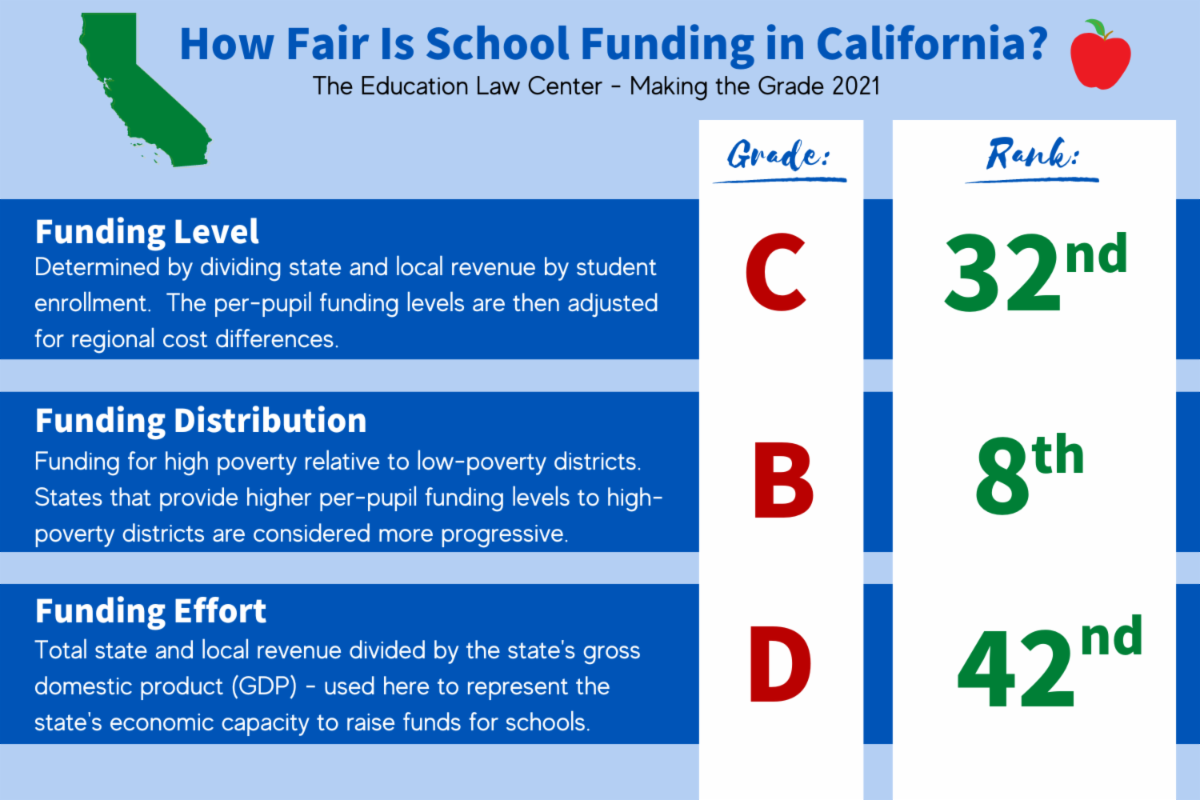
In 2021, The Education Law Center released a report grading public education finance systems across the nation. They ranked each state and graded them on Funding Level, or how much schools are funded per pupil, Funding Distribution, or how well the state provides higher funding levels to high-poverty districts, and Funding Effort, or school revenue divided by the state's Gross Domestic Product. Let's look at how California performed. |
|
California ranks well above average for Funding Distribution. The Local Control Funding Formula is the 8th most progressive funding distribution in the country, earning California a grade of B. Unfortunately, California ranks below average for Funding Level, ranking 32nd in the country for per-pupil funding adjusted for regional cost differences. And we rank well below average for Funding Effort. California is 42nd in the country when you divide state and local revenue by Gross Domestic Product. |
|
| The graph to the right illustrates California's school Funding Level as compared to that of some other states as well as to the national average, adjusted for regional cost differences.
California' Funding Level is below the national average, and schools in states like New York and Vermont receive almost twice as much funding as schools in California do.
Now let's look at some graphs that illustrate how funds are distributed among school districts in California and what that means for us here in Moraga. |
|
|
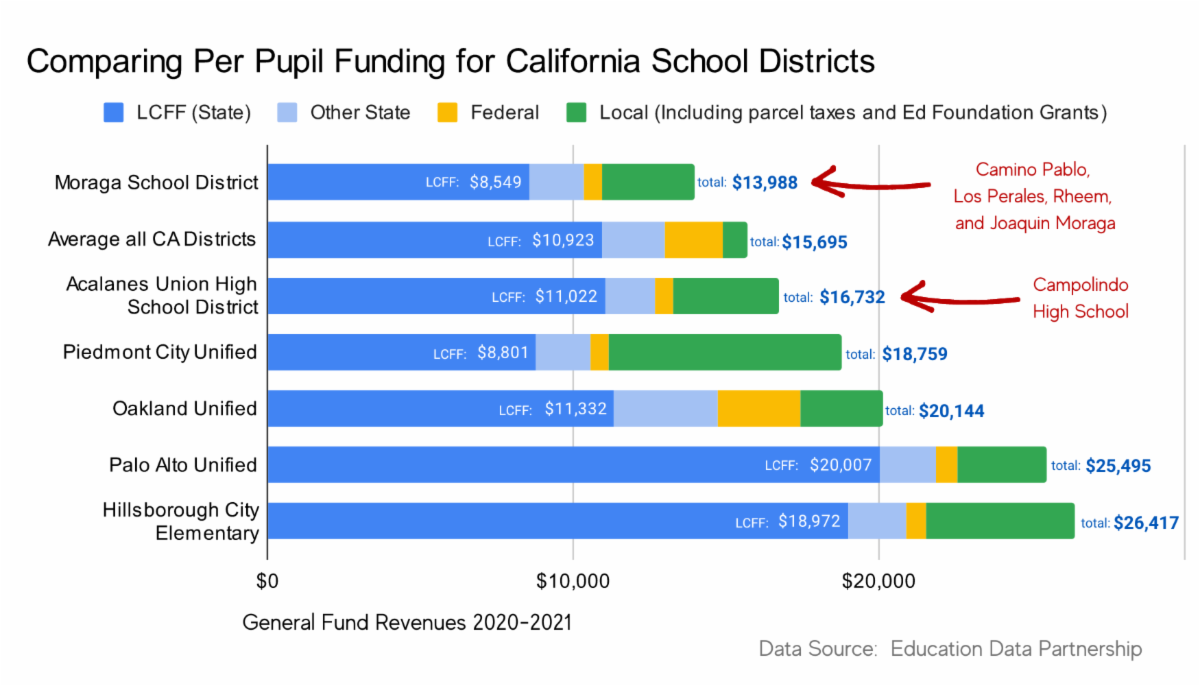
The graph below shows various local districts and the amount of funding they receive under LCFF, from other state funding, federal funding, and local funding. Local funding includes items like parcel taxes and grants from education foundations like MEF (the Moraga Education Foundation). |
|
| Note: You'll remember that elementary and high school districts receive different amounts of funding under LCFF. But since there are "unified" districts in this graph, serving TK-12th grade students, we included the average for all CA districts to compare. Later, we will show the comparison of the Moraga School District to the average elementary district and the Acalanes Union High School District to the average high school district.
It is clear in this graph how much less funding our schools receive under LCFF than some of our neighboring districts. That could be because the other districts have a large number of students who qualify for supplemental or concentration funding under LCFF, or, in the case of districts like Palo Alto and Hillsborough, it could be because they are Basic Aid Districts (or Community Funded) rather than LCFF Districts (or State Funded). What does this mean? |
|
|
|
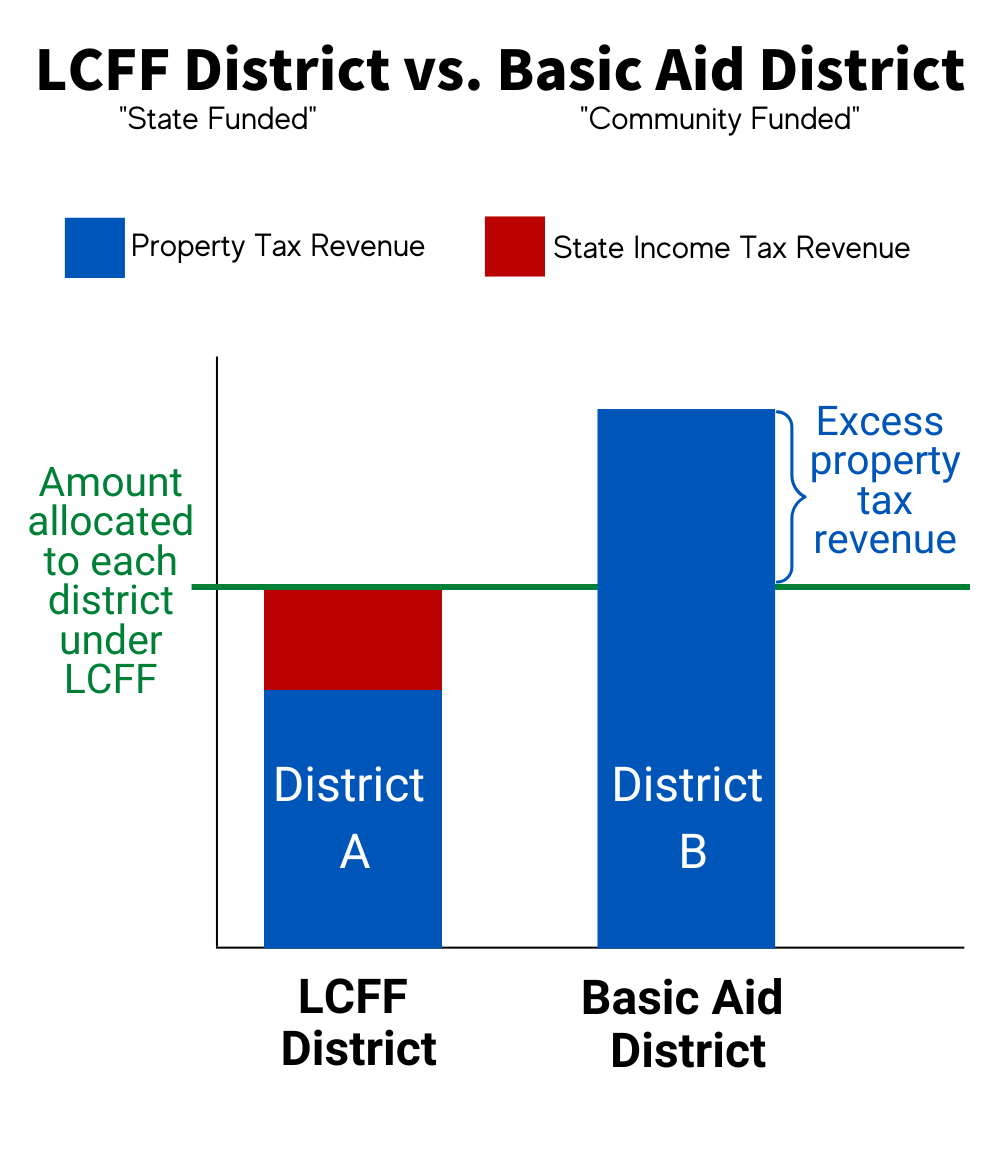
| Two districts - District A and District B - have similar student populations and are allocated the same amount per pupil under LCFF. That amount is represented in this image by the green line.
To satisfy each district's entitlement under LCFF, the government first allocates the amount generated by local property taxes to each district (represented by the blue bar). In District A, the amount generated by local property taxes is less than their share under LCFF, so it is supplemented by income tax revenue from the state to get the district up to the LCFF allocation amount. Districts like this are called "LCFF Districts" or "State Funded Districts". In District B, the amount generated by local property taxes is more than their share under LCFF. These districts are called "Basic Aid Districts" or "Community Funded Districts". Basic Aid Districts keep the excess property tax revenue generated by their community.
This is why two communities with substantially similar student populations can receive vastly different amounts under LCFF. |
|
|
|
The Moraga School District is an LCFF District, which means that Moraga does not generate enough property tax revenue to satisfy its allocation under LCFF. The funding allocated to the Moraga School District under LCFF is satisfied by local property tax revenue and state income tax revenue. Let's take a closer look.
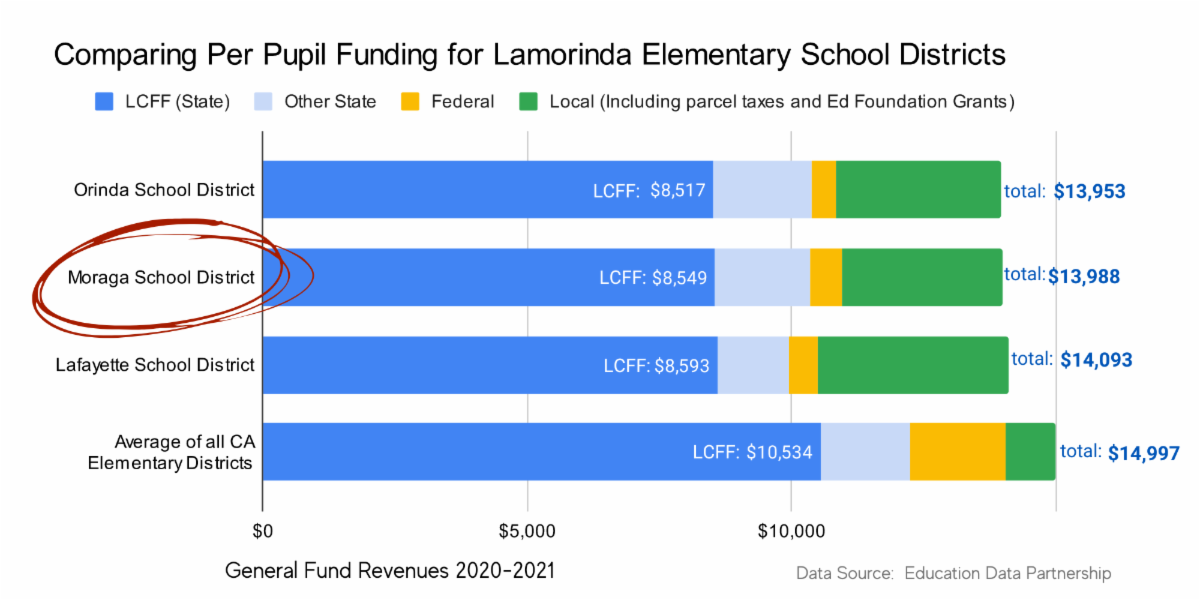
MSD is among the lowest-funded elementary districts in the state, and our local property taxes still do not fully fund our LCFF allocation. The chart below compares MSD to the other elementary districts in Orinda and Lafayette. As you can see, we are all in a similar situation. |
|
|
The amount allocated to our elementary districts under LCFF is well below the state average of all elementary districts. It is no surprise that each of our communities has a strong education foundation that raises funds each year to supplement inadequate state funding. The funds raised by education foundations like MEF are included in the green bar and make a significant impact on our districts' overall funding. |
|
|
The Acalanes Union High School District (AUHSD), which is comprised of Campolindo, Miramonte, Acalanes, and Los Lomas High Schools is sometimes an LCFF District and sometimes a Basic Aid District. Historically, the property tax revenue generated by the area is just about the same as what the district is allocated under LCFF. In the years that it's just under, state income taxes supplement the property taxes to bring their funding up to their LCFF allocation amount. In the years that it's just over, AUHSD gets to keep the excess property taxes. But AUHSD is definitely in a different situation than some other Basic Aid Districts. Even when AUHSD does qualify as a Basic Aid District, the excess property tax revenue is minimal and does not significantly increase the amount that AUHSD collects under LCFF. |
|
| Let's take a closer look at Acalanes Union High School District compared to other high school districts.
In the chart below, you can see that the amount allocated to each Campolindo student under LCFF is less than the state average for all high school districts. In fact, AUHSD's LCFF allocation puts it among the lowest-funded high school districts in the state. It really is the local support - represented by the green bar - that makes the difference at Campolindo and brings it above the state average in per-pupil funding. |
|
|
|
When public schools are underfunded, they don't have the resources they need to provide an excellent education to their students. If families can afford it, they send their kids to private schools, and the kids who are left behind receive a substandard education.
Here in Moraga, our community believes in excellent public education for all of our students. So for over 40 years, since public education funding began to decline after the passage of Proposition 13, families and community members have donated to the Moraga Education Foundation to help fund grants to the Moraga School District and Campolindo High School.
It is thanks to community donations to MEF that our schools have robust counseling programs, art and music education, libraries, academic support, widely available technology, a wide variety of course selections, a College & Career Center, equipment and supplies, supplemental curriculum, and so much more.
California has failed to adequately fund its public schools for decades, but the community of Moraga has reclaimed our local control over the success of our schools by investing in our students and teachers, ensuring that every child has access to the education they deserve. Thank you for your ongoing support of the Moraga Education Foundation and our schools. |
|
|
|
|